A quick peek into the report
Table of Contents
1.1 Trends: Current and Future Impact Assessment
1.1.1 Real-Time Route Optimization Twins for Intralogistics
1.1.2 Predictive Maintenance?and?Condition Monitoring
1.1.3 Human and AMR Collaboration
1.1.4 Vendor-Independent Interoperability and Drop-in Modularity
1.2 Supply Chain Overview
1.2.1 Key Players within the Supply Chain
1.2.2 Value Chain Analysis
1.3 Patent Analysis
1.3.1 Patent Filing Trend by Country
1.3.2 Patent Filing Trend by Company
1.4 Regulatory Landscape
1.4.1 Industrial Safety Standards
1.4.1.1 ISO 3691-4 (Industrial Trucks - Automated Operation)
1.4.1.2 ANSI B56 series (Forklift Safety)
1.4.2 Cyber-Physical Security and Data Privacy
1.4.2.1 ISA/IEC 62443 (Control System Cybersecurity)
1.4.2.2 GDPR/NIST SP 800-53 (Data Handling for SaaS)
1.4.3 Environmental and Emissions Regulations
1.4.3.1 EU Machinery Directive 2006/42/EC (CE Marking)
1.4.3.2 OTR 2024 (India’s Omnibus Technical Regulation for Machinery)
1.4.4 Vehicle Certification and Interoperability
1.4.4.1 UL 3100 (Autonomy-Enabled Devices)
1.4.4.2 ISO 15118 (Vehicle-to-Grid Communication)
1.5 Technology Analysis
1.5.1 End-to-End Material Tracking Technologies
1.5.2 Integration with ERP and WMS Systems
1.5.3 Real-Time Inventory Management Solutions
1.5.4 Sensors for Automated Vehicles
1.6 Pricing and Licensing Models
1.6.1 CapEx vs. OpEx Comparison
1.6.2 SaaS Subscription Tiers and Bundles
1.6.2.1 Autonomous Mobile Robots (AMRs)
1.6.2.2 Automated Guided Vehicles (AGVs) (including Tuggers)
1.6.2.3 Automated Forklifts
1.6.2.4 Cobots
1.6.2.5 Others
1.6.3 Pay-Per-Use and Outcome-Based Models
1.7 Case Studies
1.7.1 Mobility-as-a-Service (MaaS) Market Opportunity: Target Customer Segments and Use Cases
1.8 Use Case Analysis
1.8.1 Inbound Raw-Material Tracking
1.8.2 Work-in-Progress (WIP) Transport
1.8.3 Warehouse-to-Production Line Mobility
1.8.4 Cross-Docking and Sequencing
1.8.5 Outbound Palletizing
1.8.6 Finished Goods Movement
1.9 Market Dynamics
1.9.1 Market Drivers
1.9.1.1 Operational Efficiency and Quality Enhancement
1.9.1.2 Labor-Cost Reduction and Skill Shortages
1.9.1.3 Industry 4.0 and Smart Factory Initiatives
1.9.2 Market Challenges
1.9.2.1 High Up-Front CapEx and Integration Complexity
1.9.2.2 Limited Interoperability across Mixed Fleets
1.9.2.3 Skill Gaps in Robotics and Data Analytics
1.9.3 Market Opportunities
1.9.3.1 Robotics-as-a-Service and Subscription Models
1.9.3.2 AI-Powered Fleet Orchestration and Autonomous Coordination
1.9.3.3 5G-Enabled Real-Time Tracking and Edge Computing
2.1 Application Summary
2.2 Factory-of-the-Future Mobility Solutions Market (by End-Use Industry)
2.2.1 Automotive and Auto Components
2.2.2 Electronics and Consumer Goods
2.2.3 Pharmaceuticals
2.2.4 Aerospace and Defense
2.2.5 Others
3.1 Product Summary
3.2 Factory-of-the-Future Mobility Solutions Market (by Vehicle Type)
3.2.1 Autonomous Mobile Robots (AMRs)
3.2.2 Automated Forklifts
3.2.3 Automated Guided Vehicles
3.2.4 Cobots
3.2.5 Others
3.3 Factory-of-the-Future Mobility Solutions Market (by Solution Type)
3.3.1 Software Platform
3.3.2 Hardware
3.3.3 Services
3.4 Factory-of-the-Future Mobility Solutions Market (by Deployment Model)
3.4.1 On-Premises License
3.4.2 Mobility-as-a-Service (MaaS)
4.1 Regional Summary
4.2 North America
4.2.1 Regional Overview
4.2.2 Driving Factors for Market Growth
4.2.3 Factors Challenging the Market
4.2.4 Application
4.2.5 Product
4.2.6 North America by Country
4.2.6.1 U.S.
4.2.6.1.1 Application
4.2.6.1.2 Product
4.2.6.2 Canada
4.2.6.2.1 Application
4.2.6.2.2 Product
4.2.6.3 Mexico
4.2.6.3.1 Application
4.2.6.3.2 Product
4.3 Europe
4.3.1 Regional Overview
4.3.2 Driving Factors for Market Growth
4.3.3 Factors Challenging the Market
4.3.4 Application
4.3.5 Product
4.3.6 Europe by Country
4.3.6.1 Germany
4.3.6.1.1 Application
4.3.6.1.2 Product
4.3.6.2 France
4.3.6.2.1 Application
4.3.6.2.2 Product
4.3.6.3 U.K.
4.3.6.3.1 Application
4.3.6.3.2 Product
4.3.6.4 Italy
4.3.6.4.1 Application
4.3.6.4.2 Product
4.3.6.5 Rest-of-Europe
4.3.6.5.1 Application
4.3.6.5.2 Product
4.4 Asia-Pacific
4.4.1 Regional Overview
4.4.2 Driving Factors for Market Growth
4.4.3 Factors Challenging the Market
4.4.4 Application
4.4.5 Product
4.4.6 Asia-Pacific by Country
4.4.6.1 China
4.4.6.1.1 Application
4.4.6.1.2 Product
4.4.6.2 Japan
4.4.6.2.1 Application
4.4.6.2.2 Product
4.4.6.3 India
4.4.6.3.1 Application
4.4.6.3.2 Product
4.4.6.4 South Korea
4.4.6.4.1 Application
4.4.6.4.2 Product
4.4.6.5 Rest-of-Asia-Pacific
4.4.6.5.1 Application
4.4.6.5.2 Product
4.5 Rest-of-the-World
4.5.1 Regional Overview
4.5.2 Driving Factors for Market Growth
4.5.3 Factors Challenging the Market
4.5.4 Application
4.5.5 Product
4.5.6 Rest-of-the-World by Region
4.5.6.1 South America
4.5.6.1.1 Application
4.5.6.1.2 Product
4.5.6.2 Middle East and Africa
4.5.6.2.1 Application
4.5.6.2.2 Product
5.1 Next Frontiers
5.2 Geographic Assessment
5.2.1 Global Market Share Analysis
5.2.2 Strategic Initiatives (Partnerships, Acquisitions, Product Launches)
5.3 Company Profiles
5.3.1 Teradyne (Teradyne Robotics)
5.3.1.1 Overview
5.3.1.2 Top Products/Product Portfolio
5.3.1.3 Top Competitors
5.3.1.4 Target Customers
5.3.1.5 Key Personal
5.3.1.6 Analyst View
5.3.1.7 Market Share, 2024
5.3.2 Zebra Technologies
5.3.2.1 Overview
5.3.2.2 Top Products/Product Portfolio
5.3.2.3 Top Competitors
5.3.2.4 Target Customers
5.3.2.5 Key Personal
5.3.2.6 Analyst View
5.3.2.7 Market Share, 2024
5.3.3 Agility Robotics
5.3.3.1 Overview
5.3.3.2 Top Products/Product Portfolio
5.3.3.3 Top Competitors
5.3.3.4 Target Customers
5.3.3.5 Key Personal
5.3.3.6 Analyst View
5.3.3.7 Market Share, 2024
5.3.4 Boston Dynamics
5.3.4.1 Overview
5.3.4.2 Top Products/Product Portfolio
5.3.4.3 Top Competitors
5.3.4.4 Target Customers
5.3.4.5 Key Personal
5.3.4.6 Analyst View
5.3.4.7 Market Share, 2024
5.3.5 FANUC
5.3.5.1 Overview
5.3.5.2 Top Products/Product Portfolio
5.3.5.3 Top Competitors
5.3.5.4 Target Customers
5.3.5.5 Key Personal
5.3.5.6 Analyst View
5.3.5.7 Market Share, 2024
5.3.6 Omron Adept Technologies
5.3.6.1 Overview
5.3.6.2 Top Products/Product Portfolio
5.3.6.3 Top Competitors
5.3.6.4 Target Customers
5.3.6.5 Key Personal
5.3.6.6 Analyst View
5.3.6.7 Market Share, 2024
5.3.7 SEW-Eurodrive
5.3.7.1 Overview
5.3.7.2 Top Products/Product Portfolio
5.3.7.3 Top Competitors
5.3.7.4 Target Customers
5.3.7.5 Key Personal
5.3.7.6 Analyst View
5.3.7.7 Market Share, 2024
5.3.8 KUKA AG
5.3.8.1 Overview
5.3.8.2 Top Products/Product Portfolio
5.3.8.3 Top Competitors
5.3.8.4 Target Customers
5.3.8.5 Key Personal
5.3.8.6 Analyst View
5.3.8.7 Market Share, 2024
5.3.9 Hyster-Yale Group
5.3.9.1 Overview
5.3.9.2 Top Products/Product Portfolio
5.3.9.3 Top Competitors
5.3.9.4 Target Customers
5.3.9.5 Key Personal
5.3.9.6 Analyst View
5.3.9.7 Market Share, 2024
5.3.10 Geek+
5.3.10.1 Overview
5.3.10.2 Top Products/Product Portfolio
5.3.10.3 Top Competitors
5.3.10.4 Target Customers
5.3.10.5 Key Personal
5.3.10.6 Analyst View
5.3.10.7 Market Share, 2024
5.3.11 Jungheinrich AG
5.3.11.1 Overview
5.3.11.2 Top Products/Product Portfolio
5.3.11.3 Top Competitors
5.3.11.4 Target Customers
5.3.11.5 Key Personal
5.3.11.6 Analyst View
5.3.11.7 Market Share, 2024
5.3.12 ABB
5.3.12.1 Overview
5.3.12.2 Top Products/Product Portfolio
5.3.12.3 Top Competitors
5.3.12.4 Target Customers
5.3.12.5 Key Personal
5.3.12.6 Analyst View
5.3.12.7 Market Share, 2024
5.3.13 Locus Robotics
5.3.13.1 Overview
5.3.13.2 Top Products/Product Portfolio
5.3.13.3 Top Competitors
5.3.13.4 Target Customers
5.3.13.5 Key Personal
5.3.13.6 Analyst View
5.3.13.7 Market Share, 2024
5.3.14 KION Group
5.3.14.1 Overview
5.3.14.2 Top Products/Product Portfolio
5.3.14.3 Top Competitors
5.3.14.4 Target Customers
5.3.14.5 Key Personal
5.3.14.6 Analyst View
5.3.14.7 Market Share, 2024
5.3.15 Rockwell Automation (OTTO Motors)
5.3.15.1 Overview
5.3.15.2 Top Products/Product Portfolio
5.3.15.3 Top Competitors
5.3.15.4 Target Customers
5.3.15.5 Key Personal
5.3.15.6 Analyst View
5.3.15.7 Market Share, 2024
5.4 Other Key Players
6.1 Data Sources
6.1.1 Primary Data Sources
6.1.2 Secondary Data Sources
6.1.3 Data Triangulation
6.2 Market Estimation and Forecast
Table 1: Market Snapshot
Table 2: Competitive Landscape Snapshot
Table 3: Trends: Current and Future Impact Assessment
Table 4: Key Players Within Supply Chain
Table 5: Technology Components
Table 6: Integration Architecture
Table 7: Key Benefits and Future Developments
Table 8: Integration Mechanisms
Table 9: Data Flow Architecture
Table 10: Operational Benefits
Table 11: Technology Component
Table 12: System Integration Matrix
Table 13: Operational Impact
Table 14: Advanced Capabilities
Table 15: Sensor Suite Configuration
Table 16: Safety and Navigation Matrix
Table 17: Data Processing Architecture
Table 18: Integration Benefits
Table 19: Future Sensor Evolution
Table 20: Technology Convergence Impact
Table 21: Comparison of CAPEX and OPEX for Factory Mobility Vehicle
Table 22: Key Performance Benefits
Table 23: Operational Impact Matrix
Table 24: Supply Loop Optimization
Table 25: Cross-Docking vs. Traditional Flow
Table 26: Sequencing Requirements (by Industry)
Table 27: System Integration Benefits
Table 28: Emerging Technologies (by Use Case)
Table 29: Drivers, Challenges, and Opportunities, 2024-2035
Table 30: Global Factory-of-the-Future Mobility Solutions Market (by Region), Units, 2024-2035
Table 31: Global Factory-of-the-Future Mobility Solutions Market (by Region), $Million, 2024-2035
Table 32: North America Factory-of-the-Future Mobility Solutions Market (by End-Use Industry), Units, 2024-2035
Table 33: North America Factory-of-the-Future Mobility Solutions Market (by End-Use Industry), $Million, 2024-2035
Table 34: North America Factory-of-the-Future Mobility Solutions Market (by Vehicle Type), Units, 2024-2035
Table 35: North America Factory-of-the-Future Mobility Solutions Market (by Vehicle Type), $Million, 2024-2035
Table 36: North America Factory-of-the-Future Mobility Solutions Market (by Solution Type), $Million, 2024-2035
Table 37: North America Factory-of-the-Future Mobility Solutions Market (by Deployment Method), Units, 2024-2035
Table 38: North America Factory-of-the-Future Mobility Solutions Market (by Deployment Method), $Million, 2024-2035
Table 39: U.S. Factory-of-the-Future Mobility Solutions Market (by End-Use Industry), Units, 2024-2035
Table 40: U.S. Factory-of-the-Future Mobility Solutions Market (by End-Use Industry), $Million, 2024-2035
Table 41: U.S. Factory-of-the-Future Mobility Solutions Market (by Vehicle Type), Units, 2024-2035
Table 42: U.S. Factory-of-the-Future Mobility Solutions Market (by Vehicle Type), $Million, 2024-2035
Table 43: U.S. Factory-of-the-Future Mobility Solutions Market (by Solution Type), $Million, 2024-2035
Table 44: U.S. Factory-of-the-Future Mobility Solutions Market (by Deployment Method), Units, 2024-2035
Table 45: U.S. Factory-of-the-Future Mobility Solutions Market (by Deployment Method), $Million, 2024-2035
Table 46: Canada Factory-of-the-Future Mobility Solutions Market (by End-Use Industry), Units, 2024-2035
Table 47: Canada Factory-of-the-Future Mobility Solutions Market (by End-Use Industry), $Million, 2024-2035
Table 48: Canada Factory-of-the-Future Mobility Solutions Market (by Vehicle Type), Units, 2024-2035
Table 49: Canada Factory-of-the-Future Mobility Solutions Market (by Vehicle Type), $Million, 2024-2035
Table 50: Canada Factory-of-the-Future Mobility Solutions Market (by Solution Type), $Million, 2024-2035
Table 51: Canada Factory-of-the-Future Mobility Solutions Market (by Deployment Method), Units, 2024-2035
Table 52: Canada Factory-of-the-Future Mobility Solutions Market (by Deployment Method), $Million, 2024-2035
Table 53: Mexico Factory-of-the-Future Mobility Solutions Market (by End-Use Industry), Units, 2024-2035
Table 54: Mexico Factory-of-the-Future Mobility Solutions Market (by End-Use Industry), $Million, 2024-2035
Table 55: Mexico Factory-of-the-Future Mobility Solutions Market (by Vehicle Type), Units, 2024-2035
Table 56: Mexico Factory-of-the-Future Mobility Solutions Market (by Vehicle Type), $Million, 2024-2035
Table 57: Mexico Factory-of-the-Future Mobility Solutions Market (by Solution Type), $Million, 2024-2035
Table 58: Mexico Factory-of-the-Future Mobility Solutions Market (by Deployment Method), Units, 2024-2035
Table 59: Mexico Factory-of-the-Future Mobility Solutions Market (by Deployment Method), $Million, 2024-2035
Table 60: Europe Factory-of-the-Future Mobility Solutions Market (by End-Use Industry), Units, 2024-2035
Table 61: Europe Factory-of-the-Future Mobility Solutions Market (by End-Use Industry), $Million, 2024-2035
Table 62: Europe Factory-of-the-Future Mobility Solutions Market (by Vehicle Type), Units, 2024-2035
Table 63: Europe Factory-of-the-Future Mobility Solutions Market (by Vehicle Type), $Million, 2024-2035
Table 64: Europe Factory-of-the-Future Mobility Solutions Market (by Solution Type), $Million, 2024-2035
Table 65: Europe Factory-of-the-Future Mobility Solutions Market (by Deployment Method), Units, 2024-2035
Table 66: Europe Factory-of-the-Future Mobility Solutions Market (by Deployment Method), $Million, 2024-2035
Table 67: Germany Factory-of-the-Future Mobility Solutions Market (by End-Use Industry), Units, 2024-2035
Table 68: Germany Factory-of-the-Future Mobility Solutions Market (by End-Use Industry), $Million, 2024-2035
Table 69: Germany Factory-of-the-Future Mobility Solutions Market (by Vehicle Type), Units, 2024-2035
Table 70: Germany Factory-of-the-Future Mobility Solutions Market (by Vehicle Type), $Million, 2024-2035
Table 71: Germany Factory-of-the-Future Mobility Solutions Market (by Solution Type), $Million, 2024-2035
Table 72: Germany Factory-of-the-Future Mobility Solutions Market (by Deployment Method), Units, 2024-2035
Table 73: Germany Factory-of-the-Future Mobility Solutions Market (by Deployment Method), $Million, 2024-2035
Table 74: France Factory-of-the-Future Mobility Solutions Market (by End-Use Industry), Units, 2024-2035
Table 75: France Factory-of-the-Future Mobility Solutions Market (by End-Use Industry), $Million, 2024-2035
Table 76: France Factory-of-the-Future Mobility Solutions Market (by Vehicle Type), Units, 2024-2035
Table 77: France Factory-of-the-Future Mobility Solutions Market (by Vehicle Type), $Million, 2024-2035
Table 78: France Factory-of-the-Future Mobility Solutions Market (by Solution Type), $Million, 2024-2035
Table 79: France Factory-of-the-Future Mobility Solutions Market (by Deployment Method), Units, 2024-2035
Table 80: France Factory-of-the-Future Mobility Solutions Market (by Deployment Method), $Million, 2024-2035
Table 81: U.K. Factory-of-the-Future Mobility Solutions Market (by End-Use Industry), Units, 2024-2035
Table 82: U.K. Factory-of-the-Future Mobility Solutions Market (by End-Use Industry), $Million, 2024-2035
Table 83: U.K. Factory-of-the-Future Mobility Solutions Market (by Vehicle Type), Units, 2024-2035
Table 84: U.K. Factory-of-the-Future Mobility Solutions Market (by Vehicle Type), $Million, 2024-2035
Table 85: U.K. Factory-of-the-Future Mobility Solutions Market (by Solution Type), $Million, 2024-2035
Table 86: U.K. Factory-of-the-Future Mobility Solutions Market (by Deployment Method), Units, 2024-2035
Table 87: U.K. Factory-of-the-Future Mobility Solutions Market (by Deployment Method), $Million, 2024-2035
Table 88: Italy Factory-of-the-Future Mobility Solutions Market (by End-Use Industry), Units, 2024-2035
Table 89: Italy Factory-of-the-Future Mobility Solutions Market (by End-Use Industry), $Million, 2024-2035
Table 90: Italy Factory-of-the-Future Mobility Solutions Market (by Vehicle Type), Units, 2024-2035
Table 91: Italy Factory-of-the-Future Mobility Solutions Market (by Vehicle Type), $Million, 2024-2035
Table 92: Italy Factory-of-the-Future Mobility Solutions Market (by Solution Type), $Million, 2024-2035
Table 93: Italy Factory-of-the-Future Mobility Solutions Market (by Deployment Method), Units, 2024-2035
Table 94: Italy Factory-of-the-Future Mobility Solutions Market (by Deployment Method), $Million, 2024-2035
Table 95: Rest-of-Europe Factory-of-the-Future Mobility Solutions Market (by End-Use Industry), Units, 2024-2035
Table 96: Rest-of-Europe Factory-of-the-Future Mobility Solutions Market (by End-Use Industry), $Million, 2024-2035
Table 97: Rest-of-Europe Factory-of-the-Future Mobility Solutions Market (by Vehicle Type), Units, 2024-2035
Table 98: Rest-of-Europe Factory-of-the-Future Mobility Solutions Market (by Vehicle Type), $Million, 2024-2035
Table 99: Rest-of-Europe Factory-of-the-Future Mobility Solutions Market (by Solution Type), $Million, 2024-2035
Table 100: Rest-of-Europe Factory-of-the-Future Mobility Solutions Market (by Deployment Method), Units, 2024-2035
Table 101: Rest-of-Europe Factory-of-the-Future Mobility Solutions Market (by Deployment Method), $Million, 2024-2035
Table 102: Asia-Pacific Factory-of-the-Future Mobility Solutions Market (by End-Use Industry), Units, 2024-2035
Table 103: Asia-Pacific Factory-of-the-Future Mobility Solutions Market (by End-Use Industry), $Million, 2024-2035
Table 104: Asia-Pacific Factory-of-the-Future Mobility Solutions Market (by Vehicle Type), Units, 2024-2035
Table 105: Asia-Pacific Factory-of-the-Future Mobility Solutions Market (by Vehicle Type), $Million, 2024-2035
Table 106: Asia-Pacific Factory-of-the-Future Mobility Solutions Market (by Solution Type), $Million, 2024-2035
Table 107: Asia-Pacific Factory-of-the-Future Mobility Solutions Market (by Deployment Method), Units, 2024-2035
Table 108: Asia-Pacific Factory-of-the-Future Mobility Solutions Market (by Deployment Method), $Million, 2024-2035
Table 109: China Factory-of-the-Future Mobility Solutions Market (by End-Use Industry), Units, 2024-2035
Table 110: China Factory-of-the-Future Mobility Solutions Market (by End-Use Industry), $Million, 2024-2035
Table 111: China Factory-of-the-Future Mobility Solutions Market (by Vehicle Type), Units, 2024-2035
Table 112: China Factory-of-the-Future Mobility Solutions Market (by Vehicle Type), $Million, 2024-2035
Table 113: China Factory-of-the-Future Mobility Solutions Market (by Solution Type), $Million, 2024-2035
Table 114: China Factory-of-the-Future Mobility Solutions Market (by Deployment Method), Units, 2024-2035
Table 115: China Factory-of-the-Future Mobility Solutions Market (by Deployment Method), $Million, 2024-2035
Table 116: Japan Factory-of-the-Future Mobility Solutions Market (by End-Use Industry), Units, 2024-2035
Table 117: Japan Factory-of-the-Future Mobility Solutions Market (by End-Use Industry), $Million, 2024-2035
Table 118: Japan Factory-of-the-Future Mobility Solutions Market (by Vehicle Type), Units, 2024-2035
Table 119: Japan Factory-of-the-Future Mobility Solutions Market (by Vehicle Type), $Million, 2024-2035
Table 120: Japan Factory-of-the-Future Mobility Solutions Market (by Solution Type), $Million, 2024-2035
Table 121: Japan Factory-of-the-Future Mobility Solutions Market (by Deployment Method), Units, 2024-2035
Table 122: Japan Factory-of-the-Future Mobility Solutions Market (by Deployment Method), $Million, 2024-2035
Table 123: India Factory-of-the-Future Mobility Solutions Market (by End-Use Industry), Units, 2024-2035
Table 124: India Factory-of-the-Future Mobility Solutions Market (by End-Use Industry), $Million, 2024-2035
Table 125: India Factory-of-the-Future Mobility Solutions Market (by Vehicle Type), Units, 2024-2035
Table 126: India Factory-of-the-Future Mobility Solutions Market (by Vehicle Type), $Million, 2024-2035
Table 127: India Factory-of-the-Future Mobility Solutions Market (by Solution Type), $Million, 2024-2035
Table 128: India Factory-of-the-Future Mobility Solutions Market (by Deployment Method), Units, 2024-2035
Table 129: India Factory-of-the-Future Mobility Solutions Market (by Deployment Method), $Million, 2024-2035
Table 130: South Korea Factory-of-the-Future Mobility Solutions Market (by End-Use Industry), Units, 2024-2035
Table 131: South Korea Factory-of-the-Future Mobility Solutions Market (by End-Use Industry), $Million, 2024-2035
Table 132: South Korea Factory-of-the-Future Mobility Solutions Market (by Vehicle Type), Units, 2024-2035
Table 133: South Korea Factory-of-the-Future Mobility Solutions Market (by Vehicle Type), $Million, 2024-2035
Table 134: South Korea Factory-of-the-Future Mobility Solutions Market (by Solution Type), $Million, 2024-2035
Table 135: South Korea Factory-of-the-Future Mobility Solutions Market (by Deployment Method), Units, 2024-2035
Table 136: South Korea Factory-of-the-Future Mobility Solutions Market (by Deployment Method), $Million, 2024-2035
Table 137: Rest-of-Asia-Pacific Factory-of-the-Future Mobility Solutions Market (by End-Use Industry), Units, 2024-2035
Table 138: Rest-of-Asia-Pacific Factory-of-the-Future Mobility Solutions Market (by End-Use Industry), $Million, 2024-2035
Table 139: Rest-of-Asia-Pacific Factory-of-the-Future Mobility Solutions Market (by Vehicle Type), Units, 2024-2035
Table 140: Rest-of-Asia-Pacific Factory-of-the-Future Mobility Solutions Market (by Vehicle Type), $Million, 2024-2035
Table 141: Rest-of-Asia-Pacific Factory-of-the-Future Mobility Solutions Market (by Solution Type), $Million, 2024-2035
Table 142: Rest-of-Asia-Pacific Factory-of-the-Future Mobility Solutions Market (by Deployment Method), Units, 2024-2035
Table 143: Rest-of-Asia-Pacific Factory-of-the-Future Mobility Solutions Market (by Deployment Method), $Million, 2024-2035
Table 144: Rest-of-the-World Factory-of-the-Future Mobility Solutions Market (by End-Use Industry), Units, 2024-2035
Table 145: Rest-of-the-World Factory-of-the-Future Mobility Solutions Market (by End-Use Industry), $Million, 2024-2035
Table 146: Rest-of-the-World Factory-of-the-Future Mobility Solutions Market (by Vehicle Type), Units, 2024-2035
Table 147: Rest-of-the-World Factory-of-the-Future Mobility Solutions Market (by Vehicle Type), $Million, 2024-2035
Table 148: Rest-of-the-World Factory-of-the-Future Mobility Solutions Market (by Solution Type), $Million, 2024-2035
Table 149: Rest-of-the-World Factory-of-the-Future Mobility Solutions Market (by Deployment Method), Units, 2024-2035
Table 150: Rest-of-the-World Factory-of-the-Future Mobility Solutions Market (by Deployment Method), $Million, 2024-2035
Table 151: South America Factory-of-the-Future Mobility Solutions Market (by End-Use Industry), Units, 2024-2035
Table 152: South America Factory-of-the-Future Mobility Solutions Market (by End-Use Industry), $Million, 2024-2035
Table 153: South America Factory-of-the-Future Mobility Solutions Market (by Vehicle Type), Units, 2024-2035
Table 154: South America Factory-of-the-Future Mobility Solutions Market (by Vehicle Type), $Million, 2024-2035
Table 155: South America Factory-of-the-Future Mobility Solutions Market (by Solution Type), $Million, 2024-2035
Table 156: South America Factory-of-the-Future Mobility Solutions Market (by Deployment Method), Units, 2024-2035
Table 157: South America Factory-of-the-Future Mobility Solutions Market (by Deployment Method), $Million, 2024-2035
Table 158: Middle East and Africa Factory-of-the-Future Mobility Solutions Market (by End-Use Industry), Units, 2024-2035
Table 159: Middle East and Africa Factory-of-the-Future Mobility Solutions Market (by End-Use Industry), $Million, 2024-2035
Table 160: Middle East and Africa Factory-of-the-Future Mobility Solutions Market (by Vehicle Type), Units, 2024-2035
Table 161: Middle East and Africa Factory-of-the-Future Mobility Solutions Market (by Vehicle Type), $Million, 2024-2035
Table 162: Middle East and Africa Factory-of-the-Future Mobility Solutions Market (by Solution Type), $Million, 2024-2035
Table 163: Middle East and Africa Factory-of-the-Future Mobility Solutions Market (by Deployment Method), Units, 2024-2035
Table 164: Middle East and Africa Factory-of-the-Future Mobility Solutions Market (by Deployment Method), $Million, 2024-2035
Table 165: Global Market Share, 2024
Table 166: Other Key Players
Figure 1: Global Factory-of-the-Future Mobility Solutions Market (by Scenario), $Million, 2025, 2030, and 2035
Figure 2: Global Factory-of-the-Future Mobility Solutions Market, 2025 and 2035
Figure 3: Top 9 Countries, Global Factory-of-the-Future Mobility Solutions Market, $Million, 2024
Figure 4: Global Market Snapshot, 2024
Figure 5: Global Factory-of-the-Future Mobility Solutions Market, $Million, 2024 and 2035
Figure 6: Factory-of-the-Future Mobility Solutions Market (by End-Use Industry), $Million, 2024, 2030, and 2035
Figure 7: Factory-of-the-Future Mobility Solutions Market (by Vehicle Type), $Million, 2024, 2030, and 2035
Figure 8: Factory-of-the-Future Mobility Solutions Market (by Solution Type), $Million, 2024, 2030, and 2035
Figure 9: Factory-of-the-Future Mobility Solutions Market (by Deployment Method), $Million, 2024, 2030, and 2035
Figure 10: Factory-of-the-Future Mobility Solutions Market Segmentation
Figure 11: Value Chain Analysis
Figure 12: Patent Analysis (by Country), January 2021-December 2024
Figure 13: Patent Analysis (by Company), January 2021-December 2024
Figure 14: CapEx per Unit for Different Mobility Solutions, $
Figure 15: OpEx for Different Mobility Solutions, $/Hr
Figure 16: Examples of Pay-Per-Use and Outcome-Based Models
Figure 17: WIP Flow Architecture
Figure 18: Finished Goods Flow Automation
Figure 19: Global Factory-of-the-Future Mobility Solutions Market (by End-Use Industry), Units, 2024, 2030, and 2035
Figure 20: Global Factory-of-the-Future Mobility Solutions Market (by End-Use Industry), $Million, 2024, 2030, and 2035
Figure 21: Global Factory-of-the-Future Mobility Solutions Market, Automotive and Auto Components, Units, 2024-2035
Figure 22: Global Factory-of-the-Future Mobility Solutions Market, Automotive and Auto Components, $Million, 2024-2035
Figure 23: Global Factory-of-the-Future Mobility Solutions Market, Electronics and Consumer Goods, Units, 2024-2035
Figure 24: Global Factory-of-the-Future Mobility Solutions Market, Electronics and Consumer Goods, $Million, 2024-2035
Figure 25: Global Factory-of-the-Future Mobility Solutions Market, Pharmaceuticals, Units, 2024-2035
Figure 26: Global Factory-of-the-Future Mobility Solutions Market, Pharmaceuticals, $Million, 2024-2035
Figure 27: Global Factory-of-the-Future Mobility Solutions Market, Aerospace and Defense, Units, 2024-2035
Figure 28: Global Factory-of-the-Future Mobility Solutions Market, Aerospace and Defense, $Million, 2024-2035
Figure 29: Global Factory-of-the-Future Mobility Solutions Market, Others, Units, 2024-2035
Figure 30: Global Factory-of-the-Future Mobility Solutions Market, Others, $Million, 2024-2035
Figure 31: Global Factory-of-the-Future Mobility Solutions Market (by Vehicle Type), Units, 2024, 2030, and 2035
Figure 32: Global Factory-of-the-Future Mobility Solutions Market (by Vehicle Type), $Million, 2024, 2030, and 2035
Figure 33: Global Factory-of-the-Future Mobility Solutions Market (by Solution Type), $Million, 2024, 2030, and 2035
Figure 34: Global Factory-of-the-Future Mobility Solutions Market (by Deployment Method), Units, 2024, 2030, and 2035
Figure 35: Global Factory-of-the-Future Mobility Solutions Market (by Deployment Model), $Million, 2024, 2030, and 2035
Figure 36: Global Factory-of-the-Future Mobility Solutions Market, Autonomous Mobile Robots (AMRs), Units, 2024-2035
Figure 37: Global Factory-of-the-Future Mobility Solutions, Autonomous Mobile Robots (AMRs), $Million, 2024-2035
Figure 38: Global Factory-of-the-Future Mobility Solutions Market, Automated Forklifts, Units, 2024-2035
Figure 39: Global Factory-of-the-Future Mobility Solutions Market, Automated Forklifts, $Million, 2024-2035
Figure 40: Global Factory-of-the-Future Mobility Solutions Market, Automated Guided Vehicles, Units, 2024-2035
Figure 41: Global Factory-of-the-Future Mobility Solutions Market, Automated Guided Vehicles, $Million, 2024-2035
Figure 42: Global Factory-of-the-Future Mobility Solutions Market, Cobots, Units, 2024-2035
Figure 43: Global Factory-of-the-Future Mobility Solutions Market, Cobots, $Million, 2024-2035
Figure 44: Global Factory-of-the-Future Mobility Solutions Market, Others, Units, 2024-2035
Figure 45: Global Factory-of-the-Future Mobility Solutions Market Others, $Million, 2024-2035
Figure 46: Global Factory-of-the-Future Mobility Solutions Market, Software Platform, $Million, 2024-2035
Figure 47: Global Factory-of-the-Future Mobility Solutions Market, Hardware, $Million, 2024-2035
Figure 48: Global Factory-of-the-Future Mobility Solutions Market, Services, $Million, 2024-2035
Figure 49: Global Factory-of-the-Future Mobility Solutions Market, On-Premises License, Units, 2024-2035
Figure 50: Global Factory-of-the-Future Mobility Solutions Market, On-Premises License, $Million, 2024-2035
Figure 51: Global Factory-of-the-Future Mobility Solutions Market, Mobility-as-a-Service (MaaS), Units, 2024-2035
Figure 52: Global Factory-of-the-Future Mobility Solutions Market, Mobility-as-a-Service (MaaS), $Million, 2024-2035
Figure 53: U.S. Factory-of-the-Future Mobility Solutions Market, $Million, 2024-2035
Figure 54: Canada Factory-of-the-Future Mobility Solutions Market, $Million, 2024-2035
Figure 55: Mexico Factory-of-the-Future Mobility Solutions Market, $Million, 2024-2035
Figure 56: Germany Factory-of-the-Future Mobility Solutions Market, $Million, 2024-2035
Figure 57: France Factory-of-the-Future Mobility Solutions Market, $Million, 2024-2035
Figure 58: U.K. Factory-of-the-Future Mobility Solutions Market, $Million, 2024-2035
Figure 59: Italy Factory-of-the-Future Mobility Solutions Market, $Million, 2024-2035
Figure 60: Rest-of-Europe Factory-of-the-Future Mobility Solutions Market, $Million, 2024-2035
Figure 61: China Factory-of-the-Future Mobility Solutions Market, $Million, 2024-2035
Figure 62: Japan Factory-of-the-Future Mobility Solutions Market, $Million, 2024-2035
Figure 63: India Factory-of-the-Future Mobility Solutions Market, $Million, 2024-2035
Figure 64: South Korea Factory-of-the-Future Mobility Solutions Market, $Million, 2024-2035
Figure 65: Rest-of-Asia-Pacific Factory-of-the-Future Mobility Solutions Market, $Million, 2024-2035
Figure 66: South America Factory-of-Future Mobility Market, $Million, 2024-2035
Figure 67: Middle East and Africa Factory-of-the-Future Mobility Solutions Market, $Million, 2024-2035
Figure 68: Data Triangulation
Figure 69: Top-Down and Bottom-Up Approach
Figure 70: Assumptions and Limitations
Factory-of-the-Future Mobility Solutions Market Report Coverage
|
Factory-of-the-Future Mobility Solutions Market |
|||
|
Base Year |
2024 |
Market Size in 2024 |
$8,134.8 Million |
|
Forecast Period |
2025-2035 |
Value Projection and Estimation by 2035 |
$58,681.4 Million |
|
CAGR During Forecast Period |
19.94% |
Number of Pages |
222 |
|
Number of Tables |
166 | Number of Figures | 70 |
Key Market Players and Competition Synopsis
The companies that are profiled in the factory-of-the-future mobility solutions market have been selected based on inputs gathered from primary experts and by analyzing company coverage, product portfolio, and market penetration.
Some of the prominent names in the factory-of-the-future mobility solutions market are:
• Teradyne (Teradyne Robotics)
• Zebra Technologies
• Agility Robotics
• Boston Dynamics
• FANUC
• Omron Adept Technologies
• SEW-Eurodrive
• KUKA-AG
• Hyster-Yale Group
• Geek+
• ABB
• Jungheinrich AG
• Locus Robotics
• KION Group
• Rockwell Automation (OTTO Motors)
Companies that are not a part of the aforementioned pool have been well represented across different sections of the factory-of-the-future mobility solutions market report (wherever applicable).
How can this report add value to an organization?
Product/Innovation Strategy: In the factory-of-the-future mobility solutions market, product and innovation strategies are increasingly shaped by the need to manage complexity at scale, multiple powertrains, shorter vehicle lifecycles, regulatory pressure, and volatile demand. As a result, leading companies are pivoting from standalone products toward integrated, software-led solution portfolios that deliver compounding value over time. The dominant strategy is the development of modular, interoperable platforms rather than isolated tools. OEMs and technology providers are investing in manufacturing platforms that unify digital twins, manufacturing execution, intralogistics orchestration, AI analytics, and quality systems under a single control layer.
Growth/Marketing Strategy: Growth in the factory-of-the-future mobility solutions market is being driven by enterprise adoption, platform expansion, and long-term value capture rather than transactional sales. Leading players are pursuing a land-and-expand strategy, entering customer organizations through a high-impact use case such as digital twins, AGV orchestration, or AI-based quality inspection, and then scaling horizontally across plants and vertically across functions. Industry analysis shows that this approach can increase customer lifetime value by 30-50%, as software platforms naturally pull demand for adjacent modules and services.
Competitive Strategy: Competitive advantage in the factory-of-the-future mobility solutions market is increasingly defined by orchestration capability rather than individual technology leadership. As mobility manufacturers manage growing complexity, multiple powertrains, high model mix, regulatory pressure, and cost volatility, vendors and OEM partners compete on how effectively they integrate software, automation, data, and ecosystems into a coherent operating model.
Research Methodology
Factors for Data Prediction and Modelling
• The base currency considered for the factory-of-the-future mobility solutions market analysis is the US$. Currencies other than the US$ have been converted to the US$ for all statistical calculations, considering the average conversion rate for that particular year.
• The currency conversion rate has been taken from the historical exchange rate of the Oanda website.
• The information rendered in the report is a result of in-depth primary interviews, surveys, and secondary analysis.
• Where relevant information was not available, proxy indicators and extrapolation were employed.
• Any economic downturn in the future has not been taken into consideration for the market estimation and forecast.
• Technologies currently used are expected to persist through the forecast with no major technological breakthroughs.
Market Estimation and Forecast
This research study involves the usage of extensive secondary sources, such as certified publications, articles from recognized authors, white papers, annual reports of companies, directories, and major databases, to collect useful and effective information for an extensive, technical, market-oriented, and commercial study of the factory-of-the-future mobility solutions market.
The market engineering process involves the calculation of the market statistics, market size estimation, market forecast, market crackdown, and data triangulation (the methodology for such quantitative data processes has been explained in further sections). The primary research study has been undertaken to gather information and validate the market numbers for segmentation types and industry trends of the key players in the market.
Primary Research
The primary sources involve industry experts from the factory-of-the-future mobility solutions market and various stakeholders in the ecosystem. Respondents such as CEOs, vice presidents, marketing directors, and technology and innovation directors have been interviewed to obtain and verify both qualitative and quantitative aspects of this research study.
The key data points taken from primary sources include:
• validation and triangulation of all the numbers and graphs
• validation of report segmentations and key qualitative findings
• understanding the competitive landscape
• validation of the numbers of various markets for the market type
• percentage split of individual markets for geographical analysis
Secondary Research
This research study involves the usage of extensive secondary research, directories, company websites, and annual reports. It also makes use of databases, such as Hoovers, Bloomberg, Businessweek, and Factiva, to collect useful and effective information for an extensive, technical, market-oriented, and commercial study of the global market. In addition to the data sources, the study has been undertaken with the help of other data sources and websites, such as the International Federation of Robotics and the International Energy Agency (IEA).
Secondary research has been done to obtain crucial information about the industry’s value chain, revenue models, the market’s monetary chain, the total pool of key players, and the current and potential use cases and applications.
The key data points taken from secondary research include:
• segmentations and percentage shares
• data for market value
• key industry trends of the top players in the market
• qualitative insights into various aspects of the market, key trends, and emerging areas of innovation
• quantitative data for mathematical and statistical calculations
Factory-of-the-Future Mobility Solutions Market Overview

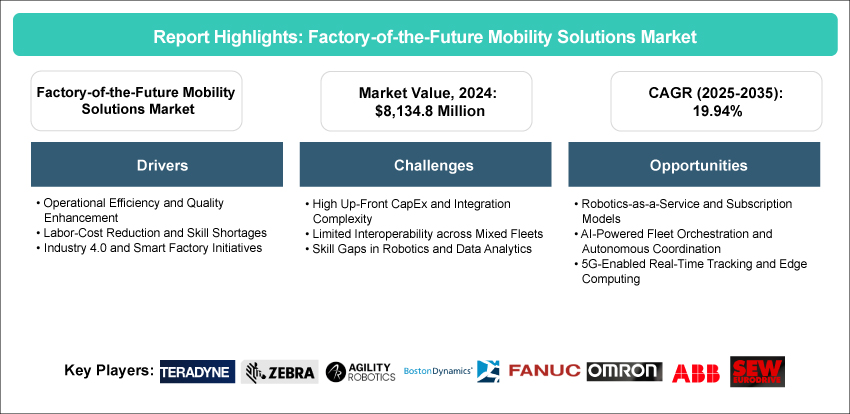
The factory-of-the-future mobility solutions market was valued at $8,134.8 million in 2024 and is projected to grow at a CAGR of 19.94%, reaching $58,681.4 million by 2035. The factory-of-the-future mobility solutions market landscape is being shaped by several decisive trends. Autonomy capabilities are advancing rapidly, with vision-based navigation, semantic mapping, and AI-enabled path planning enabling equipment to operate reliably in dynamic, less-structured environments. Interoperability is improving, driven by frameworks such as VDA-5050 and ISO 3691-4, allowing seamless mixed-fleet orchestration of AMRs, AGVs, automated forklifts, and cobots under unified management platforms. Digital twin deployment is shortening commissioning cycles, enabling layout validation and performance optimization in days rather than weeks. Commercially, automation-as-a-service and output-linked pricing models are lowering adoption barriers and aligning investment with operational performance.
From a compliance and safety standpoint, integration of collision-avoidance systems, proximity detection, and adherence to collaborative operation standards (such as ISO/TS 15066) is accelerating regulatory clearance and even unlocking insurance benefits. Structurally, labor constraints and the need for throughput stability are reinforcing automation investment, with e-commerce, semiconductor, and EV manufacturing as priority verticals.
Introduction of Factory-of-the-Future Mobility Solutions Market
The study conducted by BIS Research highlights factory-of-the-future mobility solutions as a structural reset driven by electrification, automation, digital manufacturing, and sustainability mandates. Traditional automotive production models, linear, asset-heavy, and forecast-driven, are increasingly misaligned with a market that now demands speed, customization, resilience, and lower carbon intensity. This shift has accelerated the emergence of the Factory-of-the-Future (FoF), a highly connected, intelligent, and adaptive manufacturing paradigm purpose-built for next-generation mobility solutions. In addition, Mobility-as-a-Service (MaaS) in the factory-of-the-future mobility solutions market enables manufacturers to shift from asset-heavy, fixed automation investments to usage-based, software-orchestrated mobility solutions, allowing intralogistics fleets, autonomous systems, and robotics to scale on demand while improving capital efficiency, flexibility, and time-to-value.
Market Introduction
The factory-of-the-future mobility solutions market represents a convergence of advanced manufacturing technologies, data-driven decision-making, and human-centric design. It is not a single factory blueprint, but a modular, scalable operating model that integrates cyber-physical systems across the value chain from design and engineering to production, logistics, and after-sales support. The Factory-of-the-Future is not an optional innovation; it is a strategic response to market volatility. Battery supply constraints, semiconductor shortages, and regionalized production policies have exposed the fragility of legacy manufacturing models. FoF architectures enable resilient, localized, and demand-responsive production, allowing mobility players to pivot faster across powertrains, platforms, and markets. An effective analogy is content flow optimization; just as high-performing digital content adapts to user intent and channel performance, FoF-enabled factories dynamically rebalance capacity, labor, and resources based on real-time signals, maximizing relevance, efficiency, and return on investment.
Industrial Impact
The factory-of-the-future mobility solutions market has been producing measurable, systemic impact across the mobility manufacturing landscape. Its influence extends beyond incremental efficiency gains, fundamentally reshaping how mobility products are designed, produced, scaled, and sustained across their lifecycle. The industrial impact can be assessed across five interrelated dimensions, namely, productivity, flexibility, cost structure, sustainability, and ecosystem resilience.
Market Segmentation:
Segmentation 1: by Vehicle Type
• Autonomous Mobile Robots (AMRs)
• Automated Forklifts
• Automated Guided Vehicles
• Cobots
• Others
Automated Guided Vehicles to Dominate the Factory-of-the-Future Mobility Solutions Market (by Vehicle Type)
Automated guided vehicles (AGVs) are positioned to dominate the factory-of-the-future mobility solutions market landscape due to their alignment with the structural realities of modern mobility manufacturing. Automotive and EV plants operate on highly predictable, high-frequency material flows, line feeding, pallet transfer, battery pack movement, and body-in-white logistics, where repeatability, safety, and uptime outweigh the need for navigation freedom. AGVs excel in these deterministic environments, particularly for heavy payloads exceeding 1-2 tons, where guided paths reduce collision risk and ensure process stability. Industry benchmarks indicate that AGV-led intralogistics can improve material-handling efficiency by 20-30% while reducing internal logistics labor costs by up to 40%. Much like a well-orchestrated content distribution engine that prioritizes consistency and reliability over experimentation, AGVs form the operational backbone of smart factories, providing stable, scalable, and cost-efficient material flow that supports high-volume production, regulatory compliance, and zero-defect manufacturing objectives in next-generation mobility plants.
Segmentation 2: by Solution Type
• Software Platform
• Hardware
• Services
Software Platform to Dominate the Factory-of-the-Future Mobility Solutions Market (by Solution Type)
Software platforms are set to dominate the factory-of-the-future mobility solutions market as manufacturing value increasingly shifts from physical assets to digital intelligence. In advanced mobility plants, competitive advantage no longer comes from individual machines, but from the software layer that orchestrates them, integrating MES, MOM, digital twins, AI analytics, and industrial IoT into a single decision-making backbone.
Segmentation 3: by Deployment Model
• On-Premise License
• Mobility-as-a-Service (MaaS)
On-Premises License to Dominate the Factory-of-the-Future Mobility Solutions Market (by Deployment Model)
On-premises licensing is expected to dominate the factory-of-the-future mobility solutions market by deployment method, primarily due to the sector’s stringent requirements around data sovereignty, latency control, and operational resilience. Mobility manufacturing environments generate high-frequency, mission-critical data, robot coordination, safety systems, quality inspection, and battery traceability that cannot tolerate network dependency or downtime.
Segmentation 4: by Region
• North America: U.S., Canada, and Mexico
• Europe: Germany, U.K., France, Italy, and Rest-of-Europe
• Asia-Pacific: China, Japan, India, South Korea, and Rest-of-Asia-Pacific
• Rest-of-the-World: South America and the Middle East and Africa
Currently, Europe is considerably growing in the factory-of-the-future mobility solutions market, with Germany at the forefront of this advancement. Germany also retains a deep mobility production base, with roughly 4.1 million passenger cars manufactured domestically in 2024 and a dense network of suppliers and assembly sites, conditions that accelerate the adoption of factory digitization to protect quality, speed, and competitiveness. On the automation side, Germany is among the global leaders in industrial robotics intensity (robot density around ~429 robots per 10,000 employees, per IFR), reinforcing its readiness to scale AI-enabled inspection, robotics, and connected operations across mobility plants. Finally, Germany’s institutional leadership in Industrie 4.0, supported through national initiatives focused on smart, digital production, creates a policy and standards tailwind that makes Germany the most structurally advantaged market for FoF mobility deployment in Europe.
Demand - Drivers, Limitations, and Opportunities
Market Demand Drivers: Operational Efficiency and Quality Enhancement
One of the primary drivers for robotics adoption is the pursuit of higher operational efficiency and superior product quality. Automated systems and robots can work with precision and consistency beyond human capability, leading to increased throughput and reduced error rates. By eliminating human errors and variability, companies significantly improve quality control; a recent industry survey found that 40% of manufacturers now prioritize adopting robots specifically to enhance quality. Robots can operate 24/7 without fatigue, ensuring consistent performance that boosts productivity while maintaining high-quality standards. This dual benefit of greater efficiency and improved quality makes a compelling case for investment in robotics, as it streamlines operations and reduces waste from defects or rework.
Market Challenges: High Up-Front CapEx and Integration Complexity
Despite its long-term benefits, robotics adoption comes with significant challenges, foremost among them the high initial capital expenditure and the complexity of integration. Industrial robots and automation systems often require a large up-front investment, which is needed for purchasing the robots, retrofitting facilities, and deploying new infrastructure, which can be a barrier, especially for small and mid-sized firms. Justifying the ROI can be difficult when the payback period is uncertain, and many companies find it challenging to justify the cost of robot installation at the outset. In addition, integrating robotics into existing operations is a complex task. Factories and warehouses must ensure new robots can communicate with legacy equipment, enterprise software, and each other. This often involves custom engineering, system integration work, and potential downtime during installation. The complexity of integration with existing systems is a common hurdle, requiring specialized expertise and careful planning to avoid disruptions. Companies may need to reconfigure floor layouts, upgrade power supplies or network infrastructure, and modify workflows to accommodate robots, all of which add to the implementation challenge. These factors make the adoption process daunting, as organizations must weigh the substantial initial costs and technical complexity against the future efficiency gains.
Market Opportunities: Robotics-as-a-Service and Subscription Models
Emerging business models like robotics-as-a-service (RaaS) present a promising opportunity to accelerate the factory-of-future mobility solutions market growth by lowering adoption barriers. Instead of purchasing robots outright (with large capital expenditure), companies can subscribe to robotic solutions on a pay-as-you-go or lease basis, effectively turning robotics into an operational expense. This model offers a cost-effective solution for companies to implement automation, with much lower upfront costs and faster ROI compared to the traditional approach of buying equipment.
For example, a manufacturer might pay a monthly fee or a usage-based rate (e.g., per hour or per pick) for a fleet of warehouse robots, which is often more budget-friendly than spending hundreds of thousands of dollars at once. RaaS providers typically handle installation, maintenance, and software updates as part of the service, reducing the technical burden on end users. The opportunity here is twofold: for customers, RaaS provides flexibility and scalability (they can start small and scale up automation as needed, or scale down during off-peak seasons), and for robotics vendors, it opens up a larger addressable market (including small and mid-sized businesses that previously couldn’t afford automation). This subscription-based trend aligns with the broader shift toward X-as-a-Service models in technology. As awareness grows, RaaS is expected to democratize access to robotics by mitigating the high CapEx challenge, much like cloud computing services did for IT infrastructure. In the coming years, more solution providers are likely to offer subscription models or leasing options, making robotics adoption more accessible and driving further market expansion.
Analyst View
According to Dhrubajyoti Narayan, Principal Analyst at BIS Research, “the factory-of-the-future mobility solutions market is entering a scale-up phase, where value is shifting from isolated automation projects to platform-led operating models. BMW’s decision to industrialize and roll out its Virtual Factory across 30+ sites, with a stated target of up to 30% lower production-planning costs, signals that digital twins are becoming a core enterprise capability rather than a pilot tool, especially ahead of multiple vehicle launches and factory changeovers. Leaders are standardizing on digital twins, AI-enabled manufacturing platforms, and partner ecosystems to convert smart factory investment into repeatable, multi-plant performance improvements, moving the market from “technology adoption” to “industrial operating advantage.”
Factory-of-the-Future Mobility Solutions Market - A Global and Regional Analysis
Focus on End-Use Industry, Vehicle Type, Solution Type, Deployment Model, and Country Level Analysis - Analysis and Forecast, 2025-2035
Frequently Asked Questions
Factory-of-the-future mobility solutions refer to an advanced manufacturing paradigm designed specifically to support the production of next-generation mobility products, electric vehicles (EVs), autonomous systems, connected vehicles, and emerging mobility platforms, through digitally integrated, intelligent, and sustainable factories. It represents a shift from traditional, linear automotive manufacturing to software-orchestrated, data-driven, and highly flexible production ecosystems.
The factory-of-the-future mobility solutions market presents multiple high-value business opportunities as OEMs and suppliers modernize production to support EVs, autonomous systems, and software-defined vehicles. These opportunities span technology, services, and ecosystems, with strong recurring-revenue potential and long-term strategic relevance.
To strengthen their market position in the factory-of-the-future mobility solutions industry, existing players have been adopting several strategic initiatives:
• Strategic Partnerships and Collaborations: Existing players in the factory-of-the-future mobility solutions industry are increasingly adopting strategic, system-level approaches to defend and expand their market positions as competition intensifies and technology cycles accelerate. Rather than competing solely on hardware or isolated solutions, incumbents are repositioning themselves as platform owners, ecosystem orchestrators, and long-term transformation partners.
• Integration of MES/MOM: One major strategy is the shift toward platform consolidation and standardization. Leading players are integrating MES/MOM, digital twins, intralogistics control, AI analytics, and quality management into unified platforms that can be replicated across multiple plants. This approach increases customer lock-in and raises switching costs, with analysts estimating that standardized, multi-plant deployments can improve share-of-wallet by 20-40%. The strategy resembles a content hub model, where controlling the central platform ensures consistent engagement and long-term relevance.
• Ecosystem-Based Co-Innovation: Market leaders are also deepening their positions through ecosystem-based co-innovation. Rather than building everything in-house, companies are forming structured partnerships with robotics vendors, AI startups, cloud and edge providers, and system integrators. With more than 60% of large FoF projects now involving multi-vendor stacks, incumbents that act as ecosystem coordinators gain strategic control over complex deployments and improve win rates on large transformation contracts.
For a new company entering the factory-of-the-future mobility solutions market, competing head-on with established OEMs and large automation vendors is neither practical nor necessary. The most effective path to differentiation lies in targeting high-growth, underserved, and software-led value pools where incumbents are slower to innovate.
The primary USP of this report lies in its mobility-first, factory-of-the-future lens, which moves beyond generic Industry 4.0 analysis to deliver actionable, decision-ready insights tailored specifically to next-generation mobility manufacturing. Unlike conventional market reports that focus on technology inventories or high-level trends, this study integrates market data, competitive strategy, and operational impact into a single, cohesive narrative aligned with real factory transformation journeys.
This report is designed for decision-makers and strategy leaders who need to translate factory-of-the-future ambition into clear investment, technology, and competitive choices within the mobility manufacturing ecosystem. It is especially valuable for stakeholders who operate at the intersection of operations, digital transformation, and long-term growth strategy.
